Every Great Journey Begins With A Map
While Silicon Beach is home to nearly 600 startups, which include high profile unicorns such as Bird and Snap, it is but one concentrated tech hub within SoCal (Santa Barbara to San Diego) that contains an additional 3,000 innovative startups. The diversity of ideas and people working within a wide range of increasingly converging industries such as agriculture, biotech, entertainment, and information technology, are assets that fuel innovation in our region. Nonetheless, the region’s sheer size with over 24 million people stretching across 50,000 square miles can make it difficult for residents and outsiders alike to navigate. In order to unlock the region’s innovation potential and boost desirable employment opportunities, we need to first make the region’s innovation landscape understandable and accessible.
The Alliance for Southern California Innovation (Alliance) and the Boston Consulting Group (BCG) undertook the effort to help fix this regional “usability” issue. Through an extensive strategic consulting project, we collaborated to quantify and characterize the Southern California innovation landscape with the goal of better understanding the region’s strengths and opportunities. Our hope is that a more transparent accounting of innovative efforts, which lays out what is happening and where it is happening, will clarify the landscape and thus drive engagement from key stakeholders such as entrepreneurs, investors, corporate partners, universities, local governments, and communities.
As with any journey, we first needed a map. Data-driven maps will enhance the ability of local and far-flung stakeholders alike to more effectively navigate their way to relevant resources within the innovation communities that best meet their needs and aspirations. Our research and industry interviews revealed 14 distinct geographic centers, each with a clear contribution to the greater startup ecosystem in one or more areas of potential: culture, talent, or investment. These clusters or nodes were scored along various dimensions that are important to the overall startup ecosystem, including the density of startups, investors, students, and corporations.
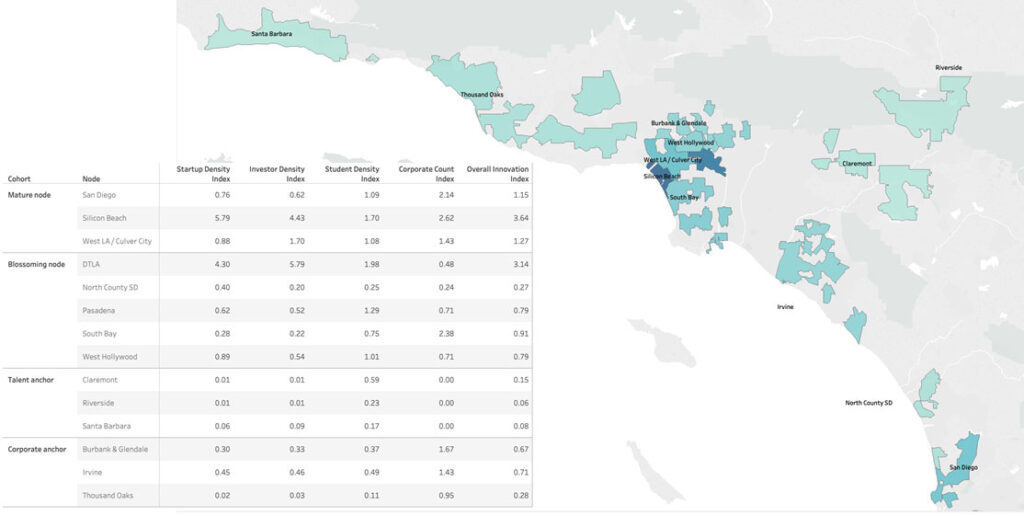
As one might expect, Silicon Beach tops most of these density measures but we were surprised to see downtown Los Angeles scoring so well in this analysis — the discrepancy between capability and perception for downtown seems like a compelling opportunity. San Diego’s legacy of life science innovation was a major contributor to their high rankings. Other top areas of innovation density include South Bay, West Hollywood and Pasadena.
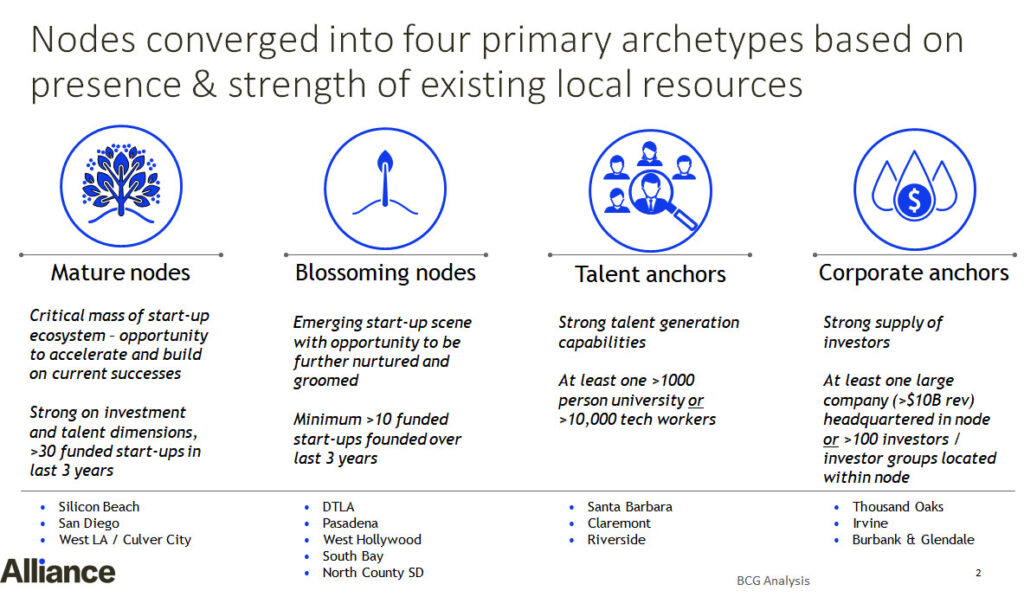
A deeper dive into the data further reveals the emergence of several major types of nodes that we have grouped into four cohorts. Each cohort has a unique opportunity to leverage its existing assets to improve interaction and impact with other nodes. See the graphic below for a high-level representation of the four cohorts and their characteristics.
Though a lot of effort has gone into building the maps and creating these archetypes, we realize they are just a starting point. We are actively seeking partners who share our passion for understanding innovation in Southern California in hopes that we may work together to further develop these maps and evolve them into dynamic living tools that can benefit the entire community.
We are eager to connect with you to build out these vibrant communities. In a future blog post we will further explore the second part of the BCG work which focuses on key activation strategies for helping the various nodes more fully realize their potential. If we are successful, the impacts can be huge — creating 200,000 new direct jobs and 1 million indirect new jobs in the next decade! Join us in this effort, we can’t do it alone.
@Eric Eide is Director of Ecosystem Development at the Alliance for SoCal Innovation. You can also find him on LinkedIn.